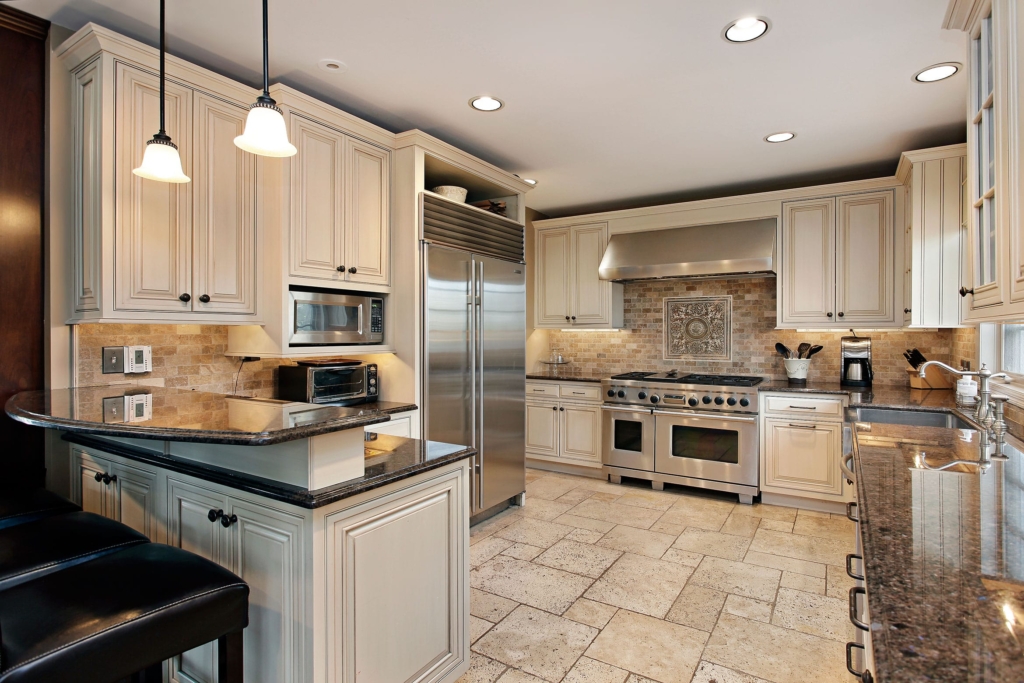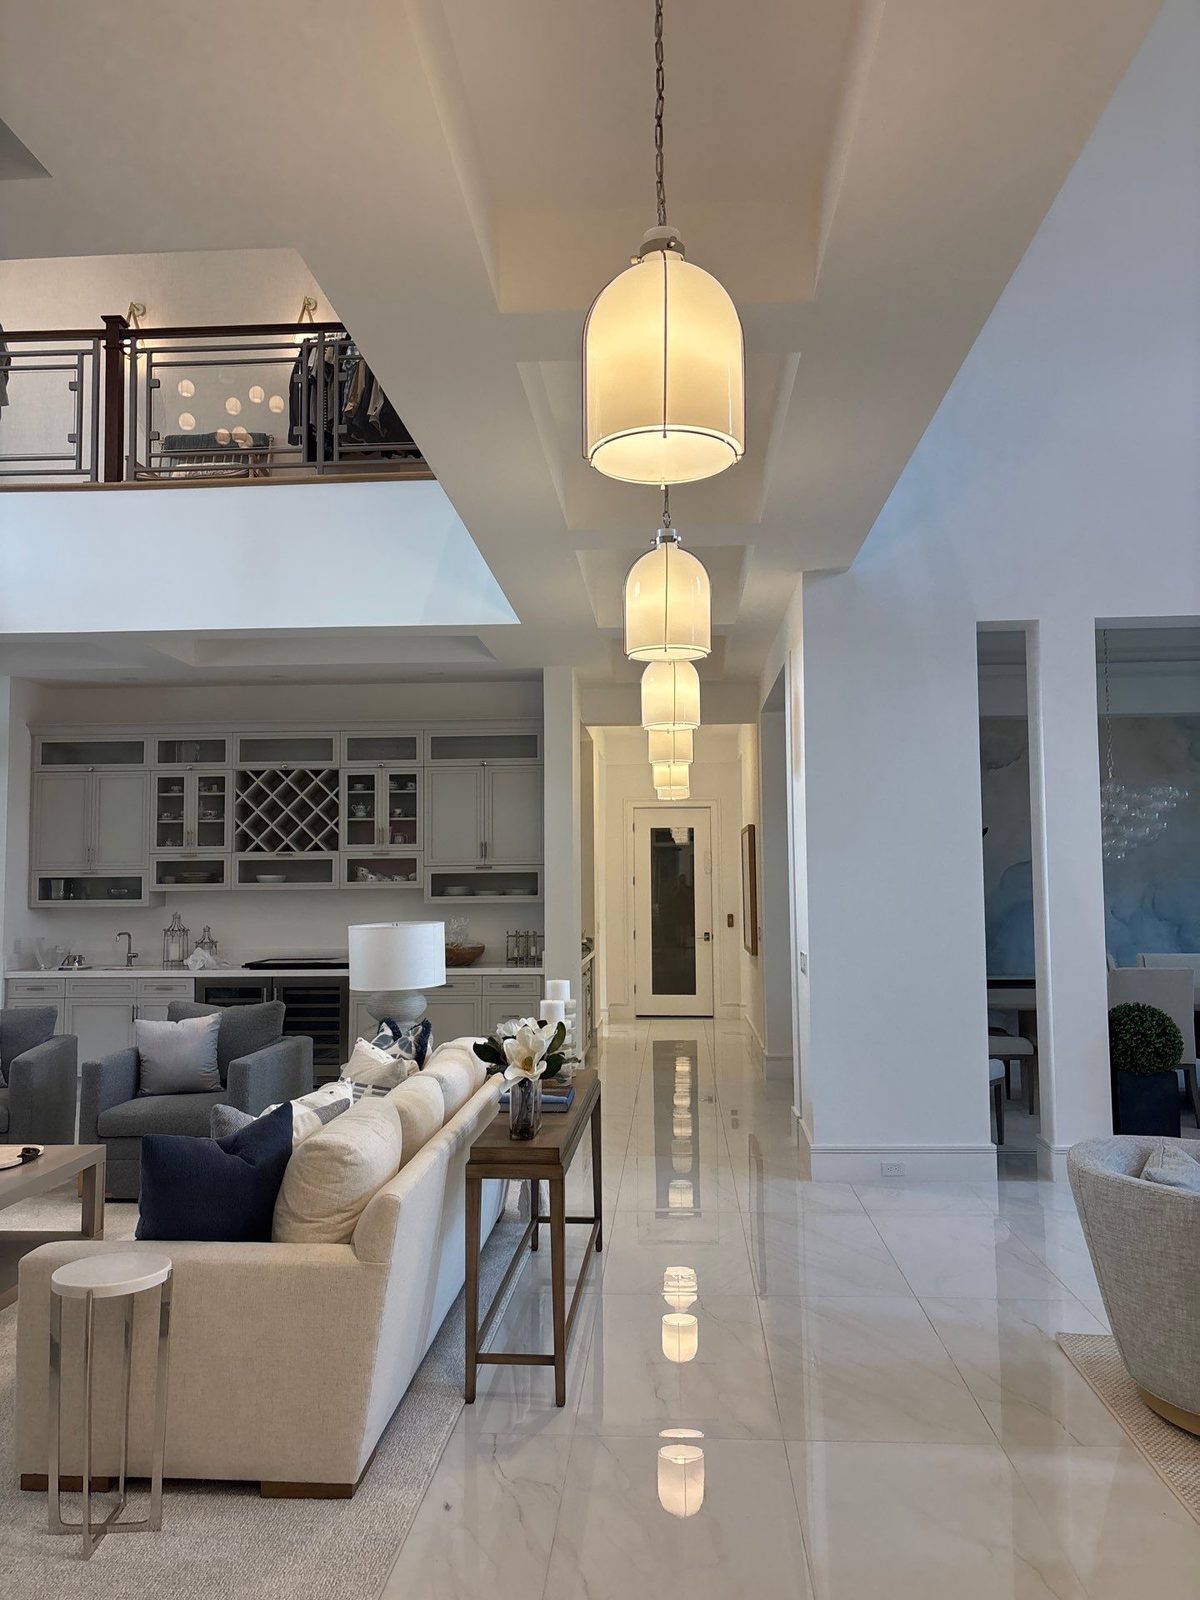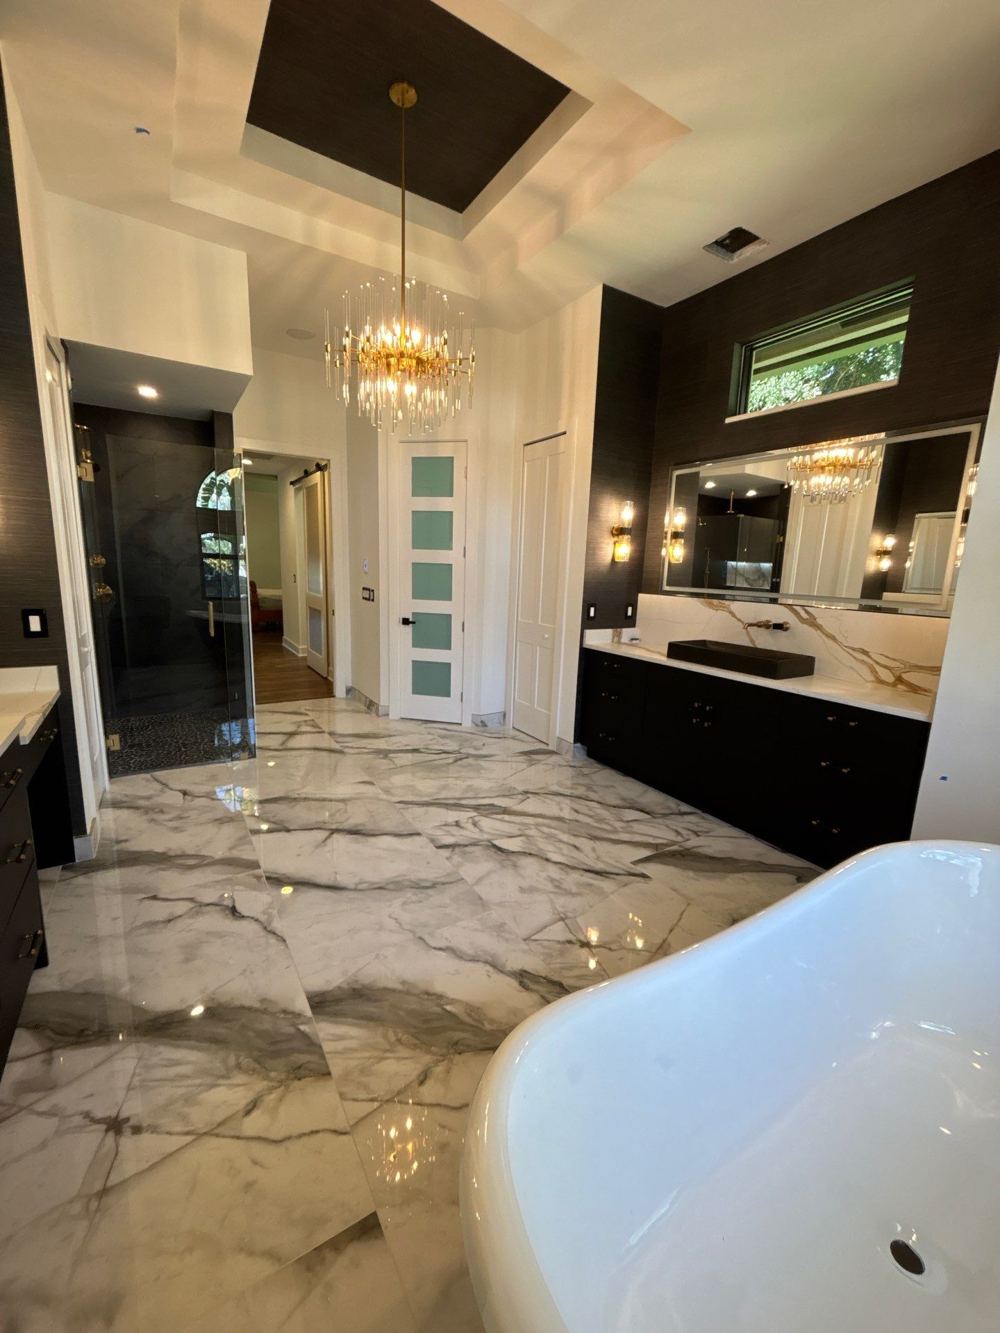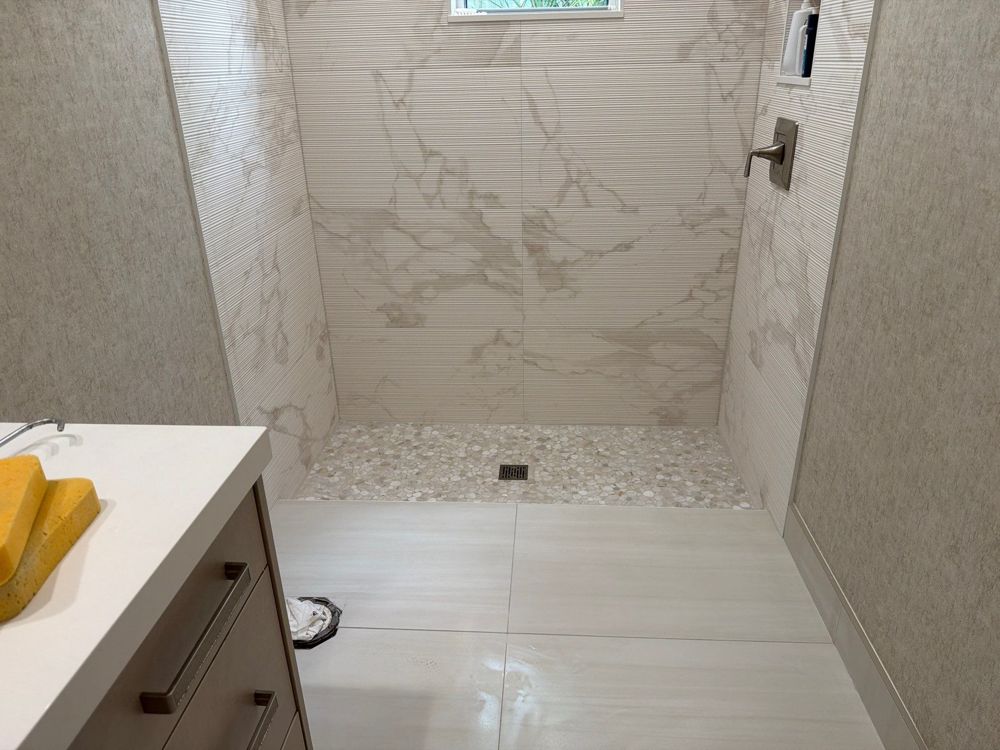
These kitchen and bathroom remodeling statistics collect the 2026 national figures on spending, project choices, water use and housing age in one place. Every number links to the organization that published it, and each row states the year of the data. We did not add any numbers of our own.
Use the table first. The sections below explain what each group of remodeling statistics means for a homeowner who is planning a project.
Headline numbers: remodeling statistics at a glance
| Metric | Figure | Source | Year of data |
|---|---|---|---|
| Projected US homeowner improvement and repair spending, four quarters through mid-2027 | $519 billion | Harvard Joint Center for Housing Studies (LIRA) | Projection released July 2026 |
| Projected year-over-year growth in that spending, second quarter of 2027 | 0.5% | Harvard Joint Center for Housing Studies (LIRA) | Projection released July 2026 |
| US residential kitchen and bath industry, 2026 forecast | About $228 billion | NKBA with John Burns Research and Consulting | 2026 forecast, updated July 2026 |
| Median spend, major kitchen remodel | $55,000 | 2026 U.S. Houzz Kitchen Trends Study | Published January 2026 |
| Median spend, minor kitchen remodel | $20,000 | 2026 U.S. Houzz Kitchen Trends Study | Published January 2026 |
| Median spend, major bathroom remodel | $22,000 | 2025 U.S. Houzz Bathroom Trends Study | 2024 projects |
| Median spend, all bathroom renovations | $13,000 | 2025 U.S. Houzz Bathroom Trends Study | 2024 projects |
| Renovating homeowners who remove the bathtub | 26% | Houzz, bathroom features report | 2025 study |
| Of homeowners who remove a tub, share who enlarge the shower | 82% | Houzz, bathroom features report | 2025 study |
| Bathroom projects that plan for special needs such as aging | 68% | 2025 U.S. Houzz Bathroom Trends Study | 2025 study |
| Realtors who saw more buyer demand for a kitchen upgrade / a bathroom renovation | 48% / 35% | NAR and NARI 2025 Remodeling Impact Report | Released April 2025 |
| Median age of owned US homes | 41 years | US Census Bureau, American Housing Survey | 2021 |
Most of these remodeling statistics are medians. Medians are the middle value, so half of projects cost more and half cost less. They are national figures. Local labor, materials and permit costs can move a real project well above or below them.
Market size: how much Americans spend on remodeling
The Leading Indicator of Remodeling Activity from Harvard’s Joint Center for Housing Studies tracks spending on owner-occupied homes. Its July 2026 release projects $519 billion in improvement and repair spending through mid-2027. However, growth is slowing, and the center expects year-over-year growth of just 0.5 percent in the second quarter of 2027.
The wider market is larger, and the broader remodeling statistics tell the same story. The Joint Center’s Improving America’s Housing 2025 report says the US remodeling market soared above $600 billion after the pandemic and remains 50 percent above pre-pandemic levels. That figure includes rental homes, which the LIRA leaves out.
Kitchens and baths are a big share of that work. The NKBA mid-year outlook keeps its 2026 kitchen and bath market forecast at approximately $228 billion. In short, spending is flat at a high level, not falling off a cliff.
Kitchen remodeling statistics
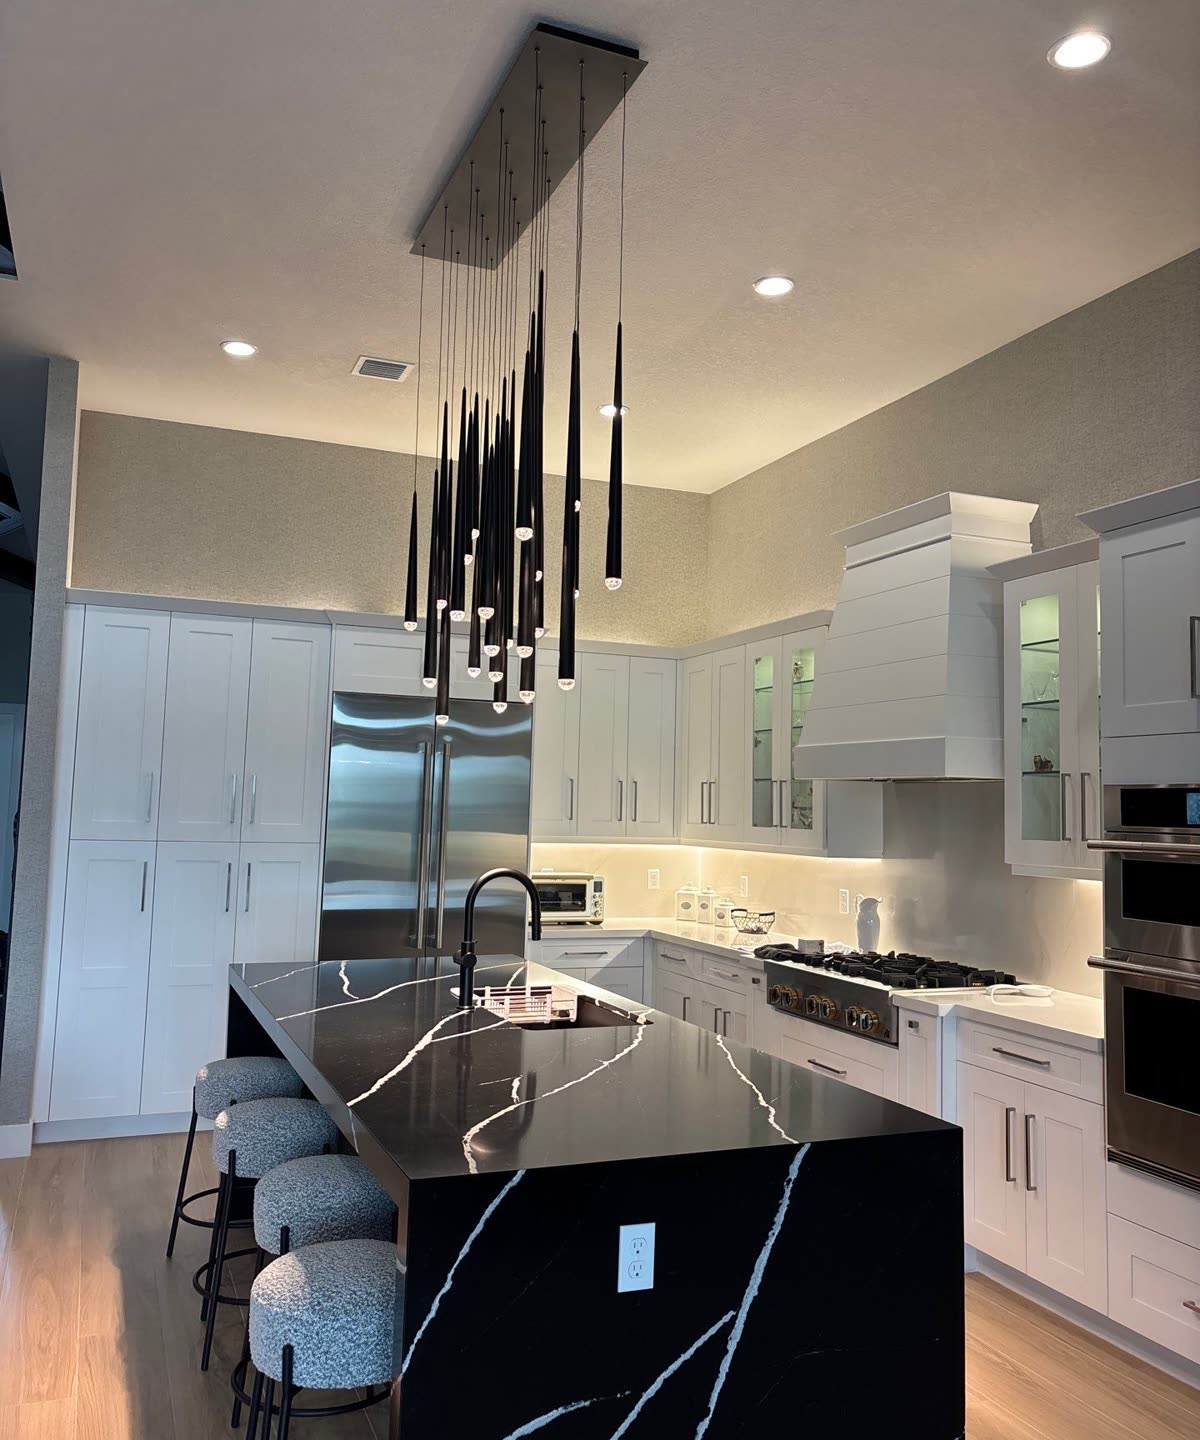
The 2026 U.S. Houzz Kitchen Trends Study surveyed 1,780 homeowners. Its kitchen remodeling statistics show a wide spread by scope and size:
- Major kitchen remodels had a median spend of $55,000. Minor remodels landed at $20,000.
- A major remodel of a larger kitchen had a median of $75,000, compared with $46,000 for a smaller space.
- 41% of renovating homeowners cited dislike of the old style as a reason to remodel, and 38% cited a kitchen that had worn out or stopped working.
- 76% added built-in features. Pantry cabinets led the list at 47%.
For a homeowner, the lesson is simple. Scope drives cost more than any single finish. Moving from a minor to a major remodel, or from a small kitchen to a large one, changes the budget far more than a countertop choice. Storage also matters to most people, which is why built-in pantry cabinets top the feature list.
Bathroom remodeling statistics
The 2025 U.S. Houzz Bathroom Trends Study surveyed 1,737 homeowners about 2024 projects. The national median spend eased to $13,000, while major remodels rose to $22,000. Bathrooms of 100 square feet or more had a median spend of $25,000.
The same study shows who does the work and why:
- 84% of homeowners hired professionals for their bathroom renovation.
- 68% considered special needs in their bathroom projects, up 4 points in a year.
- Wet rooms now account for 1 in 6 renovated bathrooms (16%).
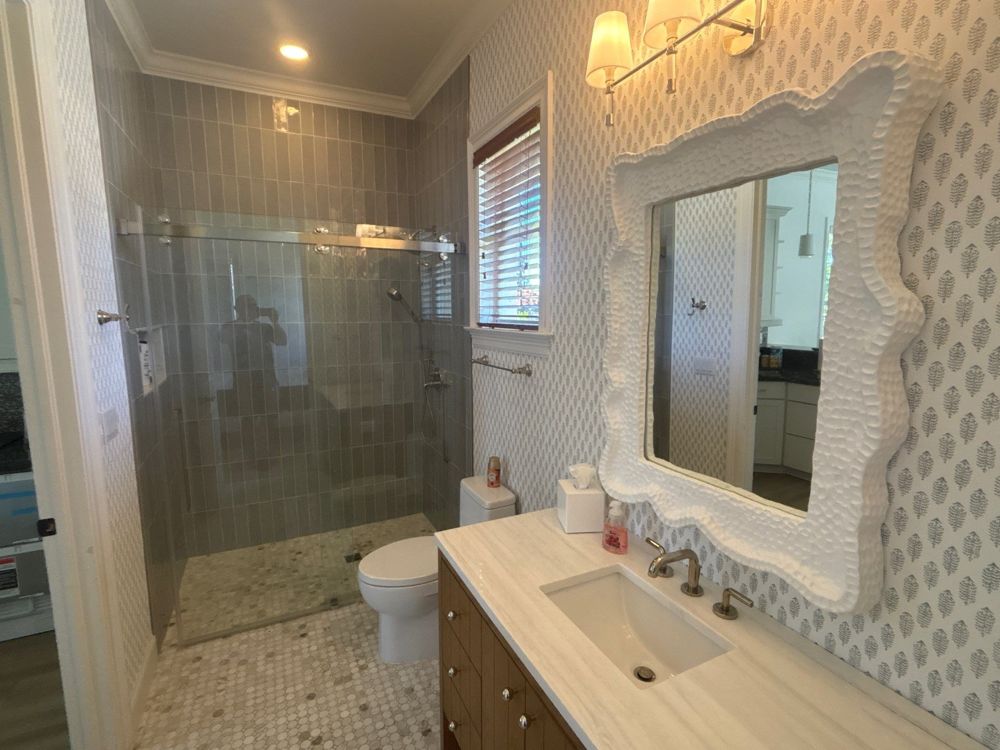
Showers get most of the attention in bathroom remodeling statistics. According to the Houzz bathroom features report, homeowners who upgrade showers favor low-curb (44%) and alcove (42%) designs, with curbless showers at 20%.
Tub-to-shower conversion statistics
Fewer bathrooms keep a tub than you might expect. In the Houzz report, 26% of renovating homeowners removed the tub, and 25% never had one. When the tub came out, 82% used the space to enlarge the shower. As a result, the tub-to-shower conversion is one of the most common bathroom changes in the data, not a niche request.
For aging-in-place planning, a low or no curb and room for a seat matter more than style. See the 2010 ADA Standards for the reference dimensions many designers use as a starting point.
Water use statistics for bathroom fixtures
A remodel is the easiest time to change fixtures. The EPA WaterSense program publishes these figures:
- Showerheads: standard showerheads use 2.5 gallons per minute. WaterSense labeled models use no more than 2.0 gpm, and the average family could save 2,700 gallons per year.
- Toilets: older toilets can use as much as 6 gallons per flush. WaterSense toilets use 1.28 gallons per flush or less, which is 20 percent less than the federal standard of 1.6 gallons per flush. Replacing old toilets saves the average family nearly 13,000 gallons a year.
- Sink faucets: WaterSense bathroom faucets use a maximum of 1.5 gallons per minute, 30 percent or more below the standard 2.2 gallons per minute. That saves the average family 700 gallons of water per year.
Housing age and who remodels
Older homes drive a lot of kitchen and bath work, and the Census remodeling statistics show why. The US Census Bureau reports that the median age of all owned homes was 41 years in 2021. Homes built before 1950 made up about 17% of homes. About 61% of owners of older homes started a home improvement project between 2019 and 2021. Interior projects were the most common type, and 47% of all homeowners nationwide took one on.
Palm Beach County residents skew older than the country. The Census Bureau’s 2024 American Community Survey puts the county’s median age at 45.2, compared with 39.2 for the United States. That fits the national Houzz finding that most bathroom projects now plan for special needs.
Budgets, demand and resale
Budgets often slip. The 2026 Houzz & Home Study found a median renovation spend of $20,000, and 37% of homeowners exceeded the budget they set in 2025. Unexpected costs are only part of it: 35% of homeowners chose higher-end materials than they first planned.
Looking ahead, the 2026 Houzz Renovation Plans Report found that 93% of homeowners plan to work with professionals in 2026. The top expected challenge was the rising cost of products and materials (63%).
Resale remodeling statistics point the same way. Buyers notice kitchens and baths. In the NAR and NARI 2025 Remodeling Impact Report, Realtors saw the biggest rise in demand for a kitchen upgrade (48%), and bathroom renovations ranked third (35%). A kitchen upgrade also earned the top Joy Score of 10.
What these remodeling statistics mean for your project
First, plan around scope, not a headline median. Second, if a tub gets little use, the data shows most homeowners who remove one put the space into a larger shower. Third, fixture choices in a bathroom remodel have a measurable water effect for years. Finally, set a budget with a margin, because more than a third of renovators go over.
We use these national remodeling statistics as context when homeowners in Palm Beach County ask how their plans compare. They are not our prices. For your own kitchen, start with our kitchen remodeling service. For baths, see bathroom remodeling and our tub-to-shower conversions. For layout ideas, browse these walk-in shower ideas.
FAQ
What is the median cost of a kitchen remodel?
The 2026 Houzz Kitchen Trends Study puts the median at $55,000 for a major remodel and $20,000 for a minor one. Kitchen size and scope move the figure the most.
What is the median cost of a bathroom remodel?
Houzz reports a national median of $13,000 for 2024 bathroom projects and $22,000 for major remodels.
How many homeowners replace a tub with a shower?
In Houzz data, 26% of renovating homeowners removed the tub, and 82% of them enlarged the shower.
Is remodeling spending going up in 2026?
Spending remains high, but the latest remodeling statistics show growth is slowing. Harvard’s LIRA projects year-over-year growth of just 0.5% by the second quarter of 2027.
Methodology and sources
We fetched every source page for these remodeling statistics in September 2026 and copied each number as published. Where we write “about,” the source used that word or a similar one. We did not compute or estimate any figure. Sources, publishers and data years:
- Harvard Joint Center for Housing Studies, Leading Indicator of Remodeling Activity, release of July 23, 2026 (projection through Q2 2027).
- Harvard Joint Center for Housing Studies, Improving America’s Housing 2025.
- National Kitchen & Bath Association with John Burns Research and Consulting, 2026 Kitchen & Bath Industry Outlook: Mid-Year Update, July 2026.
- Houzz Research, 2026 U.S. Houzz Kitchen Trends Study, January 2026, 1,780 homeowners.
- Houzz Research, 2025 U.S. Houzz Bathroom Trends Study, 1,737 homeowners, 2024 projects.
- Houzz, See the Bathroom Features Homeowners Want Most in 2025, September 2025, from the 2025 Bathroom Trends Study.
- Houzz Research, 2026 U.S. Houzz & Home Study: Renovation Trends, April 2026, 2025 projects.
- Houzz Research, 2026 U.S. Houzz Renovation Plans Report, December 2025, 1,034 homeowners.
- National Association of Realtors and National Association of the Remodeling Industry, 2025 Remodeling Impact Report, April 2025.
- US Census Bureau, American Housing Survey 2021, published October 2023.
- US Census Bureau, American Community Survey 2024 1-year estimates, via Census Reporter (Palm Beach County, United States).
- US EPA WaterSense: showerheads, toilets and bathroom faucets, current program pages.
Have questions about your own kitchen or bath? Request a consultation and we will walk through scope, timing and options with you.
Cite this page: H&H Signature Renovations, “Kitchen and Bathroom Remodeling Statistics 2026,” hhsrenovations.com, updated September 2026.