This Palm Beach County housing data shows how old the homes are in nine cities and towns and in the county as a whole. We pulled the numbers from the U.S. Census Bureau’s American Community Survey and put them in one table. As far as we know, no one else publishes a clean city-by-city view of housing age for the county’s remodeling market.
Every figure in this Palm Beach County housing data comes from the ACS 2024 5-year estimates, which cover 2020-2024. The 5-year release is the only one that covers small places such as the Town of Palm Beach. So all ten rows use the same release and can be compared fairly.
Headline numbers: Palm Beach County housing data by city
The table shows total housing units, the median year built, the share built before 1980 and before 2000, the share in buildings with 10 or more units, and the share of occupied homes that owners live in.
| Place | Housing units | Median year built | Built before 1980 | Built before 2000 | In buildings with 10+ units | Owner-occupied | Source |
|---|---|---|---|---|---|---|---|
| Palm Beach County (all) | 719,463 | 1986 | 33.5% | 75.0% | 25.1% | 70.1% | ACS data |
| West Palm Beach | 62,464 | 1988 | 37.7% | 64.4% | 38.5% | 50.5% | ACS data |
| Boca Raton | 49,128 | 1983 | 43.6% | 81.4% | 42.5% | 65.7% | ACS data |
| Delray Beach | 37,427 | 1983 | 42.8% | 77.7% | 30.8% | 63.2% | ACS data |
| Boynton Beach | 40,684 | 1984 | 41.3% | 76.0% | 29.5% | 64.7% | ACS data |
| Lake Worth Beach | 17,949 | 1969 | 74.8% | 87.6% | 19.1% | 45.9% | ACS data |
| Palm Beach Gardens | 31,400 | 1995 | 17.8% | 59.1% | 16.9% | 73.0% | ACS data |
| Wellington | 24,497 | 1995 | 12.4% | 62.4% | 6.7% | 75.8% | ACS data |
| Jupiter | 31,257 | 1989 | 15.0% | 68.8% | 21.0% | 78.5% | ACS data |
| Town of Palm Beach | 10,507 | 1970 | 70.0% | 91.0% | 64.9% | 83.7% | ACS data |
Cite this table: H&H Signature Renovations, “Palm Beach County Housing Data 2026: How Old Are Our Homes?,” hhsrenovations.com, updated September 2026. Data: U.S. Census Bureau, ACS 2024 5-year estimates.
What the Palm Beach County housing data shows
The county’s typical home dates from the mid-1980s
According to the Palm Beach County housing data, the median home in the county was built in 1986. In other words, half of the county’s 719,463 housing units are older than that. Also, 75.0% of all units were built before 2000. The 1980s were the busiest decade in the data, with 189,546 units built from 1980 to 1989. That is about a quarter of today’s housing stock.
The oldest housing is on the coast and in Lake Worth Beach
Lake Worth Beach has the oldest housing in this table. Its median home was built in 1969, and 74.8% of its units were built before 1980. The Town of Palm Beach is close behind, with a median year of 1970 and 70.0% built before 1980. Boca Raton and Delray Beach both have a median year of 1983, but more than 4 in 10 of their units predate 1980.
The newest housing is inland and to the north
Palm Beach Gardens and Wellington both have a median year built of 1995. Only 12.4% of Wellington’s units were built before 1980. Jupiter sits in between, with a median of 1989 and 15.0% built before 1980. However, “newer” is relative. Even in these places, most homes were built before 2000.
Condo and apartment buildings vary a lot by city
Across the county, 25.1% of housing units are in buildings with 10 or more units. The share climbs to 64.9% in the Town of Palm Beach and 42.5% in Boca Raton. By contrast, only 6.7% of Wellington’s units are in buildings that size. Most of Wellington’s housing is single-family homes.
Most occupied homes are owned, with two exceptions
In the county, 70.1% of occupied homes are lived in by their owners. Jupiter (78.5%) and the Town of Palm Beach (83.7%) run higher. West Palm Beach (50.5%) and Lake Worth Beach (45.9%) run lower, so renters make up about half of their households.
One note on the Town of Palm Beach. The owner share counts occupied homes only. The Census Bureau counts 4,093 of the town’s 10,507 units as vacant “for seasonal, recreational, or occasional use” (ACS table B25004). Many of those are second homes, so they sit outside the owner figure.
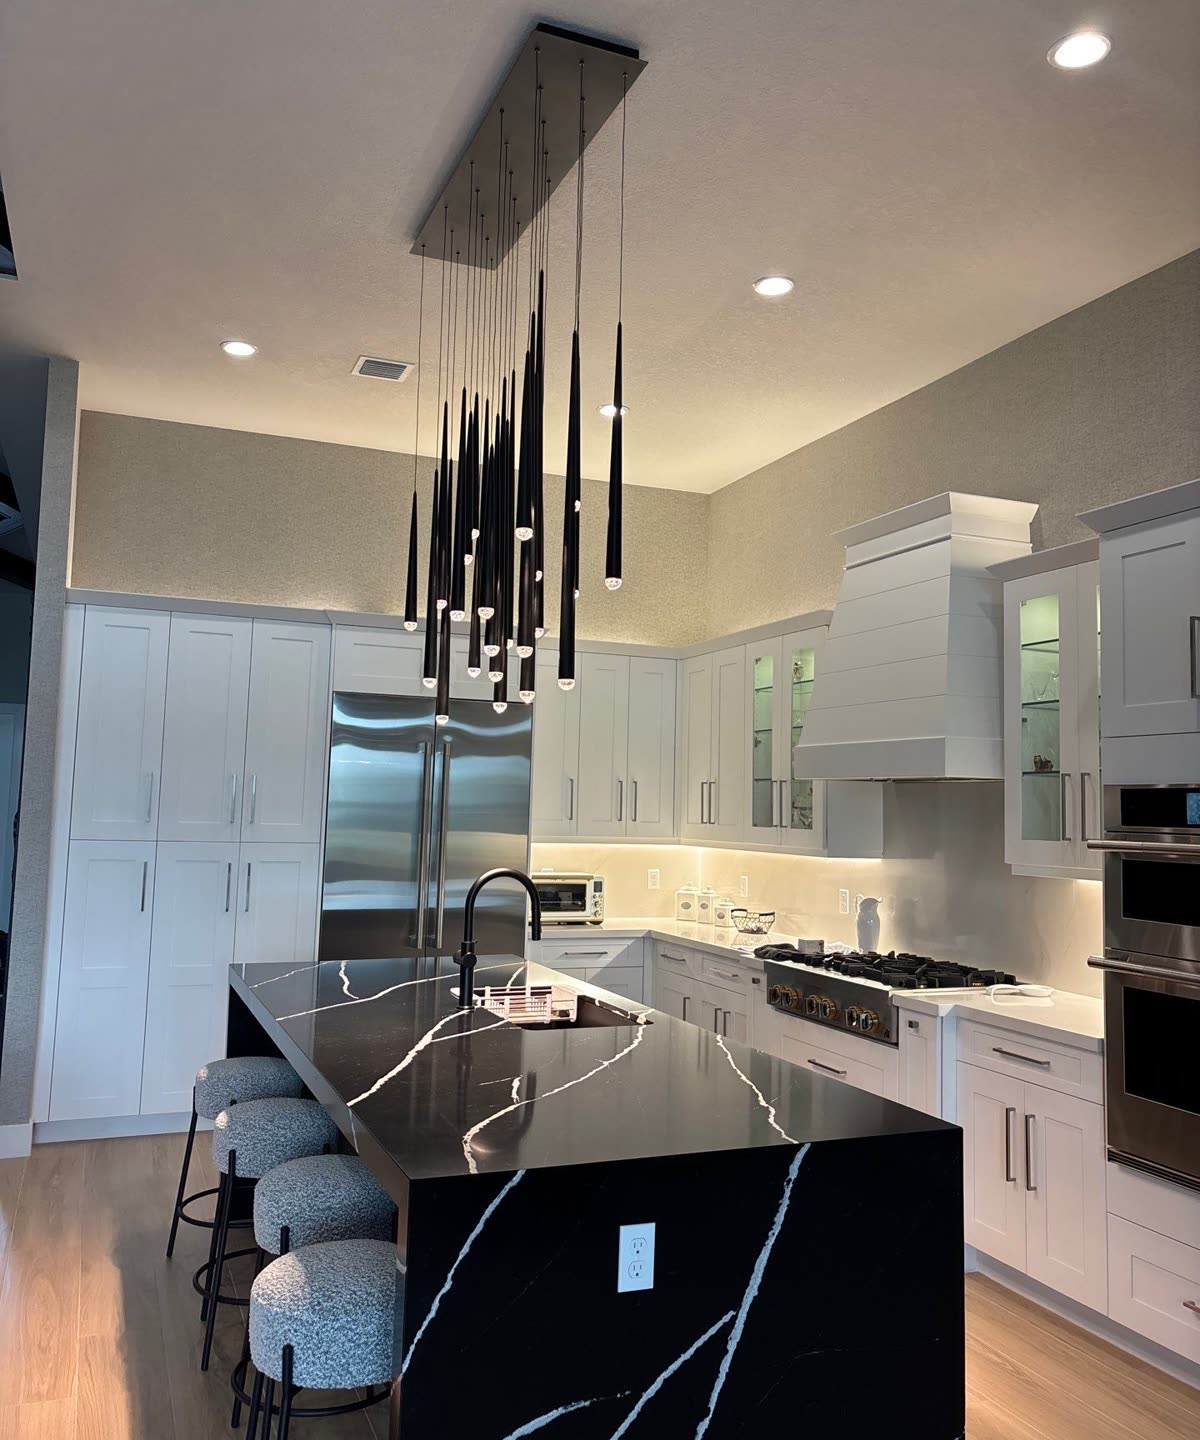
What housing age means for a remodel
A build year does not tell you the condition of a home. Many older homes have already been updated, and some newer ones have not. Still, the era a home was built in often hints at what sits behind the walls. So read the Palm Beach County housing data as a starting point for planning, not a diagnosis.
Homes built before 1980
Older homes may still have original drain lines, older supply pipes, or wiring that was not planned for today’s appliances. They can also have paint that needs care. The EPA notes: “If your home was built before 1978, it is more likely to have lead-based paint.” Our “before 1980” column includes a few later years, so treat it as a rough flag, not a test.
Homes built in the 1980s and 1990s
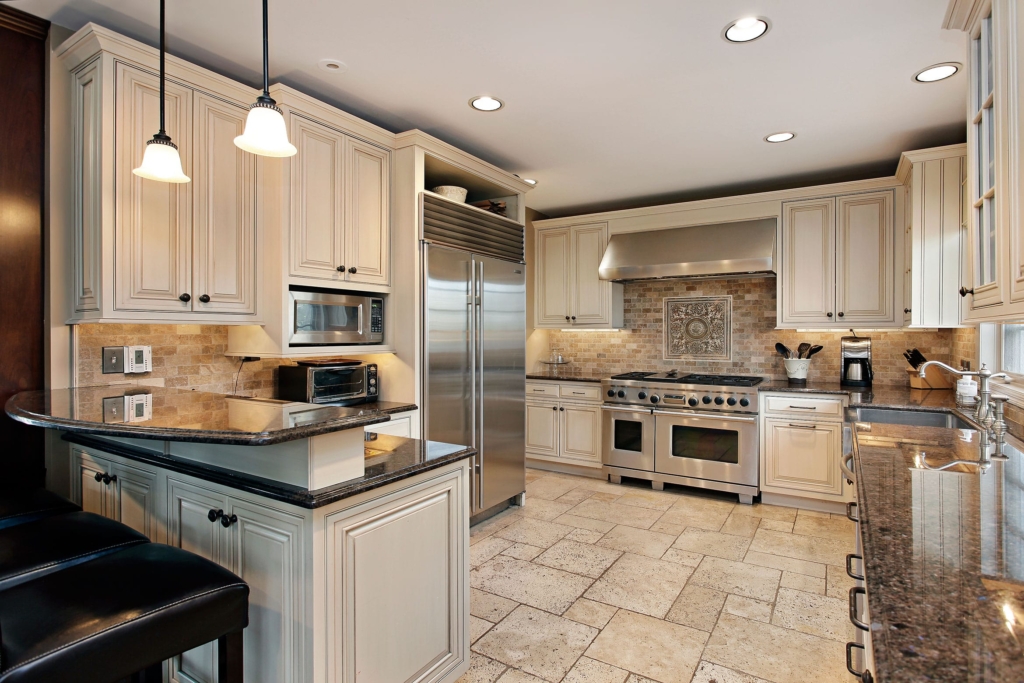
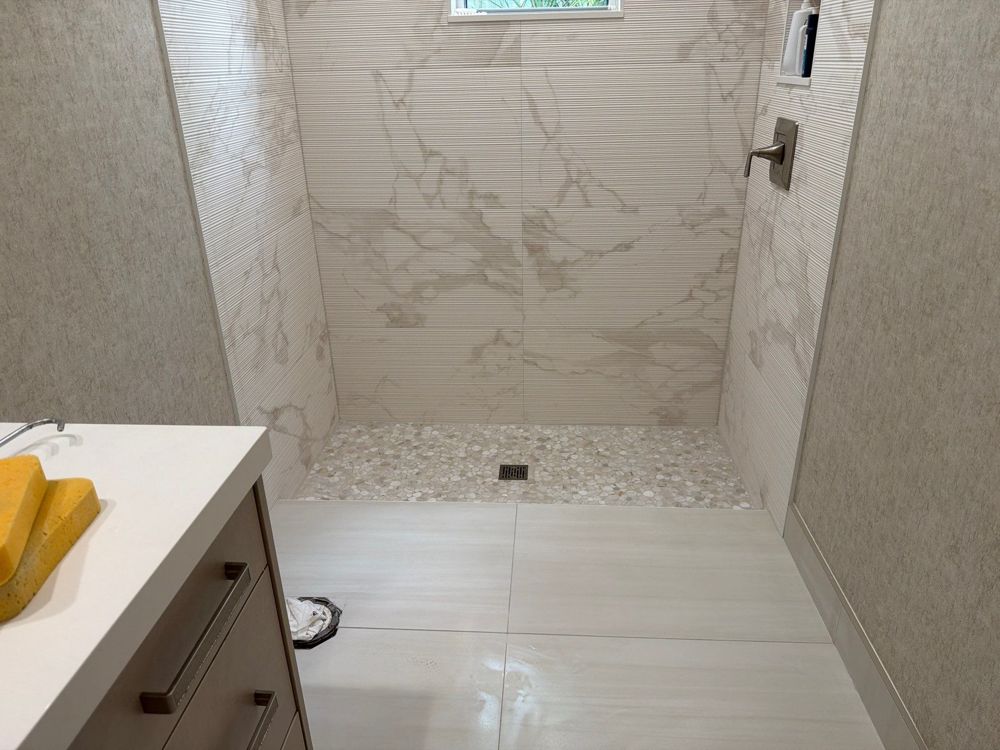
These homes make up the largest group in this Palm Beach County housing data. Many were planned with a closed kitchen, a tub in the hall bath, and builder-grade cabinets. As a result, common projects include opening a kitchen to the living area, converting a tub to a walk-in shower, and replacing original cabinets. Original shower valves and fixtures in these homes are often worth replacing while the walls are open.
Homes built since 2000
Newer homes usually need less behind-the-wall work. Owners tend to remodel for layout, storage, and finishes rather than to replace old systems. Even so, a 20-year-old bathroom can show wear at the shower pan, the grout, and the vanity.
In all three groups, the real condition only shows once the walls are open. That is why an older home can take more time to plan. It is also why a good estimate includes a clear process for surprises.
Condo share and what it means for association approvals
The Palm Beach County housing data above counts buildings by size. It does not say whether units are condos or rental apartments. Even so, a high share of units in buildings with 10 or more units points to a lot of condo living, especially in coastal cities.
That matters for remodeling. In a condo, the association usually has to approve the work before it starts. Boards often set rules for work hours, noise, elevator use, contractor insurance, and moving plumbing or walls. In addition, some buildings require sound-control underlayment under new hard floors. For a closer look, read our guide to condo renovation details Palm Beach boards actually approve.
In short, in the Town of Palm Beach, Boca Raton, and West Palm Beach, a large share of remodels will go through an association. Plan extra time for that step.
How to use this Palm Beach County housing data
We built this page for reporters, realtors, and homeowners who need a clean number with a clear source. A few tips help you use the Palm Beach County housing data correctly:
- Cite the release. Say “ACS 2024 5-year estimates” and link this page or the Census source. Do not mix these numbers with 1-year estimates.
- Remember the margin of error. Every ACS figure is an estimate from a survey. Smaller places, such as the Town of Palm Beach, have wider margins. The API links in the table show the margin for each count.
- City limits, not mailing addresses. The city rows count homes inside each city’s boundary. Many addresses that use a city name in the mail sit outside city limits, in unincorporated Palm Beach County.
- Build year is not condition. Use the age figures to describe the housing stock, not a single home.
- 10+ units is not the same as condos. The building-size column includes rental apartment buildings too.
How H&H uses Palm Beach County housing data
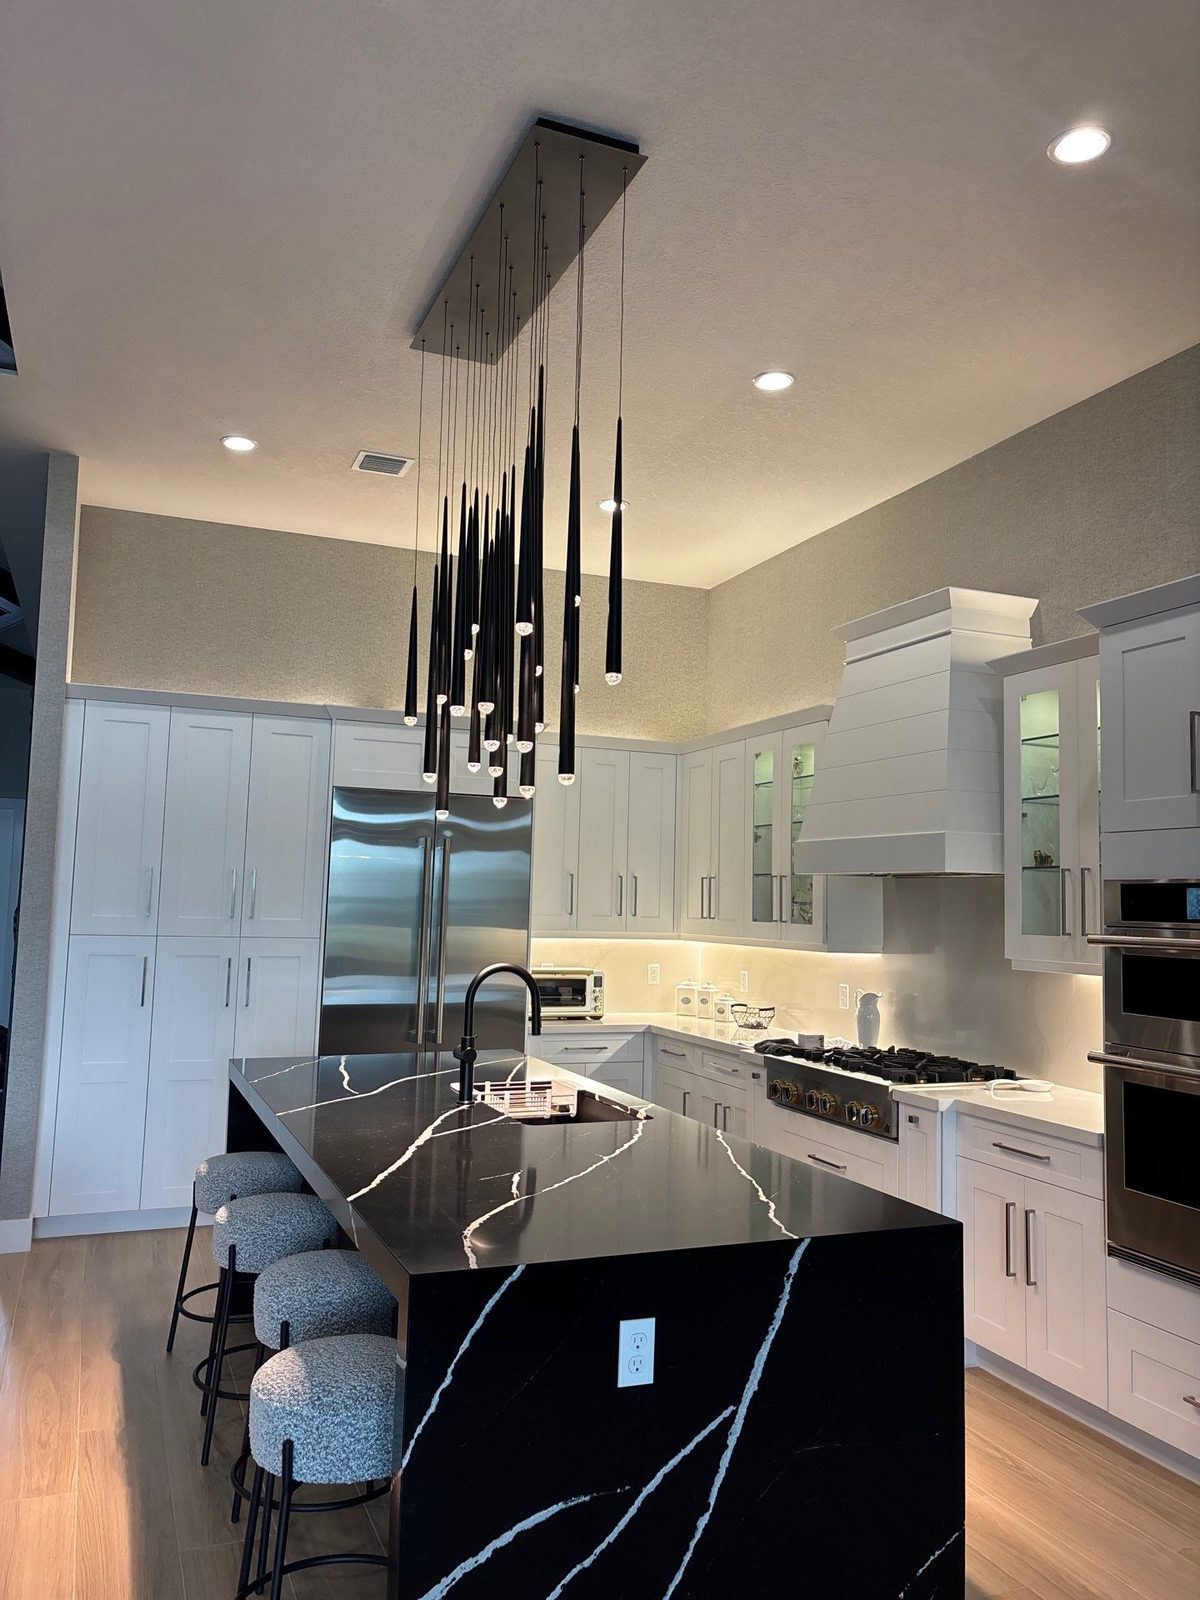
We remodel kitchens and bathrooms across the county, and a home’s age is one of the first things we ask about. It shapes the questions we ask, what we look for at the first visit, and how we plan the schedule. See the cities we work in on our Palm Beach County service areas page, or go straight to bathroom remodeling in Lake Worth Beach, bathroom remodeling in Boca Raton, or kitchen remodeling in West Palm Beach.
FAQ
How old are homes in Palm Beach County?
The median housing unit in Palm Beach County was built in 1986, according to the ACS 2024 5-year estimates. About three in four units were built before 2000.
Which city in Palm Beach County has the oldest homes?
Of the places in this table, Lake Worth Beach has the oldest housing, with a median year built of 1969. The Town of Palm Beach is next, at 1970.
What share of Palm Beach County homes are condos?
The Census survey does not count condos directly. The closest measure is the share of units in buildings with 10 or more units, which is 25.1% county-wide.
Does an older home cost more to remodel?
It can, but not always. Older homes are more likely to have hidden conditions, such as old pipes or wiring, that show up when walls open. A home that has already been updated may cost no more than a newer one.
Where does this Palm Beach County housing data come from?
It comes from the U.S. Census Bureau’s American Community Survey, ACS 2024 5-year estimates. The Methodology section below lists every table, formula, and raw count.
Methodology and sources
All Palm Beach County housing data on this page comes from the U.S. Census Bureau, American Community Survey, ACS 2024 5-year estimates (data years 2020-2024). We read them through the free Census Reporter API on September 24, 2026. We used these tables:
- B25034, Year Structure Built (housing units)
- B25035, Median Year Structure Built (housing units)
- B25024, Units in Structure (housing units)
- B25003, Tenure (occupied housing units)
- B25004, Vacancy Status (vacant housing units), for the Town of Palm Beach note
City rows use Census “place” boundaries, which match city and town limits. The Town of Palm Beach is the Census place “Palm Beach, FL”. The county row covers all of Palm Beach County, including unincorporated areas.
How we computed each column:
- Housing units = B25034 total.
- Median year built = B25035, as published. We did not compute it.
- Built before 1980 = (built 1939 or earlier + 1940 to 1949 + 1950 to 1959 + 1960 to 1969 + 1970 to 1979) ÷ total housing units.
- Built before 2000 = built before 1980 + 1980 to 1989 + 1990 to 1999, ÷ total housing units.
- In buildings with 10+ units = (10 to 19 units + 20 to 49 units + 50 or more units) ÷ total housing units, from B25024.
- Owner-occupied = owner-occupied units ÷ occupied units, from B25003. The base is occupied homes, not all homes.
We rounded each share to one decimal place. Every ACS figure has a margin of error, shown in the source data.
Raw counts: year built
| Place | Total units | 1939 or earlier | 1940 to 1949 | 1950 to 1959 | 1960 to 1969 | 1970 to 1979 | 1980 to 1989 | 1990 to 1999 |
|---|---|---|---|---|---|---|---|---|
| Palm Beach County (all) | 719,463 | 12,072 | 7,751 | 34,414 | 53,744 | 132,918 | 189,546 | 109,164 |
| West Palm Beach | 62,464 | 5,428 | 2,178 | 5,247 | 3,540 | 7,127 | 10,200 | 6,502 |
| Boca Raton | 49,128 | 421 | 240 | 1,911 | 6,841 | 12,000 | 12,505 | 6,072 |
| Delray Beach | 37,427 | 458 | 499 | 2,393 | 2,800 | 9,886 | 8,744 | 4,315 |
| Boynton Beach | 40,684 | 267 | 292 | 2,822 | 3,167 | 10,273 | 9,203 | 4,900 |
| Lake Worth Beach | 17,949 | 2,009 | 1,143 | 3,354 | 2,646 | 4,271 | 1,434 | 863 |
| Palm Beach Gardens | 31,400 | 159 | 14 | 103 | 1,767 | 3,545 | 6,783 | 6,198 |
| Wellington | 24,497 | 52 | 33 | 21 | 24 | 2,911 | 6,485 | 5,762 |
| Jupiter | 31,257 | 76 | 24 | 670 | 833 | 3,085 | 11,601 | 5,227 |
| Town of Palm Beach | 10,507 | 1,244 | 440 | 782 | 2,677 | 2,217 | 1,819 | 382 |
Raw counts: building size and tenure
| Place | 10 to 19 units | 20 to 49 units | 50 or more units | Occupied units | Owner-occupied units |
|---|---|---|---|---|---|
| Palm Beach County (all) | 43,388 | 60,923 | 76,467 | 605,430 | 424,264 |
| West Palm Beach | 4,976 | 6,051 | 13,032 | 52,522 | 26,536 |
| Boca Raton | 2,850 | 5,488 | 12,555 | 41,450 | 27,250 |
| Delray Beach | 3,065 | 3,442 | 5,003 | 29,933 | 18,928 |
| Boynton Beach | 3,396 | 3,826 | 4,796 | 32,882 | 21,265 |
| Lake Worth Beach | 1,186 | 1,247 | 994 | 15,493 | 7,119 |
| Palm Beach Gardens | 2,333 | 914 | 2,059 | 27,294 | 19,935 |
| Wellington | 1,023 | 549 | 73 | 21,859 | 16,563 |
| Jupiter | 1,976 | 2,287 | 2,314 | 25,618 | 20,113 |
| Town of Palm Beach | 488 | 1,474 | 4,859 | 5,479 | 4,585 |
Source links
Each link returns the four tables for one place. Official Census tables are also on data.census.gov: B25034, B25035, B25024 and B25003. The lead paint note comes from the U.S. Environmental Protection Agency.
- Palm Beach County (all) (05000US12099): Census Reporter API, ACS 2024 5-year
- West Palm Beach (16000US1276600): Census Reporter API, ACS 2024 5-year
- Boca Raton (16000US1207300): Census Reporter API, ACS 2024 5-year
- Delray Beach (16000US1217100): Census Reporter API, ACS 2024 5-year
- Boynton Beach (16000US1207875): Census Reporter API, ACS 2024 5-year
- Lake Worth Beach (16000US1239081): Census Reporter API, ACS 2024 5-year
- Palm Beach Gardens (16000US1254075): Census Reporter API, ACS 2024 5-year
- Wellington (16000US1275812): Census Reporter API, ACS 2024 5-year
- Jupiter (16000US1235875): Census Reporter API, ACS 2024 5-year
- Town of Palm Beach (16000US1254025): Census Reporter API, ACS 2024 5-year
Cite this page: H&H Signature Renovations, “Palm Beach County Housing Data 2026: How Old Are Our Homes?,” hhsrenovations.com, updated September 2026.
Planning a kitchen or bathroom remodel in an older home? Request a consultation and tell us when your home was built. We will plan around what we are likely to find.